


For most of baseball history, stats have been easy to follow.
See a table of Minnesota’s baseball stats
A good hitter has a batting average around .300 and a good pitcher has an earned run average under 3.00.
But over the past three decades, the sport has gone through a statistical revolution, with more advanced formulas surfacing and more people paying attention to them.
These stats, usually referred to as “sabermetrics,” named after the Society of American Baseball Research (SABR), have begun to take hold in the college game, too. Web sites like SaberScouting.com, CollegeSplits.com and TheCollegeBaseballBlog.com are part of a growing contingent of outlets using sabermetrics to analyze college baseball.
“We’re looking at advanced college stats as a helpful tool,” said Frankie Piliere, editor of SaberScouting.com. “More and more it’s becoming something we look at.”
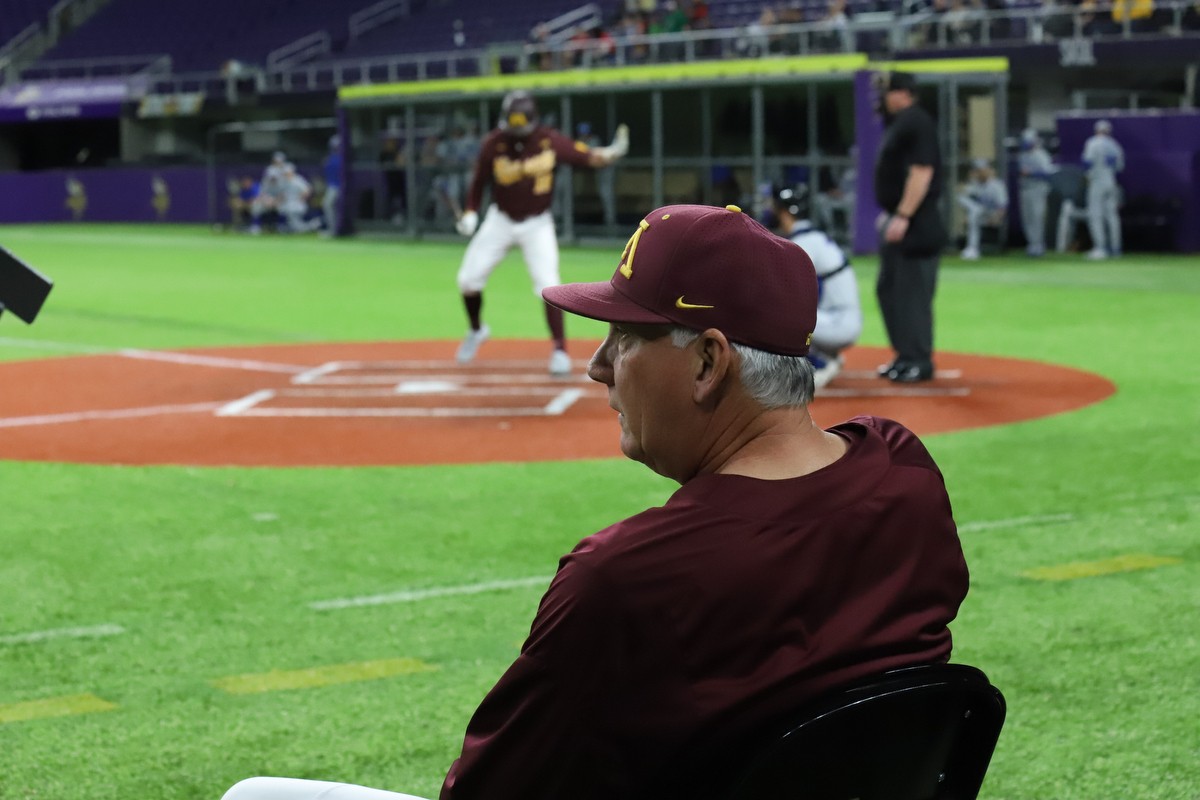
Gophers head baseball coach John Anderson said his staff charts everything from pitch and hit location to the number of well-hit balls a player hits in batting practice.
Those numbers are put into a computer each week, and Anderson’s players are given a printout of the stats and charts that they can’t find in box scores.
“The statistical information today is just so comprehensive that we can do so much more with it,” Anderson said. “We have a computer program that tells you a guy’s averages with runners in scoring position, or right versus left, and anything else you can think of. It gives you better evidence than we’ve had before of how people are doing.”
In 1977 , a 28-year-old writer named Bill James wrote “The Bill James Historical Baseball Abstract ,” in which he introduced some of his new mathematic baseball ideas. James, who coined the term “sabermetrics,” has been the movement’s biggest catalyst ever since, developing most of the popular sabermetric stats in use today.
Sabermetrics were brought further into the mainstream by Michael Lewis’s 2004 bestselling book “Moneyball: The Art of Winning an Unfair Game,” which chronicled a season with Oakland Athletics General Manager Billy Beane, a protégé of James’.
In 2003, James was hired as a consultant for the Boston Red Sox, who have since won a pair of World Series.
Despite the growing popularity of more advanced stats among bloggers and hardcore fans, these stats – particularly the ones with complex acronyms and formulas – have been slower to catch on with most mainstream media outlets and teams.
“I think they’ve had a tough time catching on at the college level because not everybody has access to all the numbers like they do in the majors,” Brian Foley, editor of TheCollegeBaseballBlog.com, said.
The one stat that has broken the barrier is the James-developed OPS, which stands for “On base Plus Slugging percentage.” OPS is referenced in many newspapers and is an official statistic kept by the Major League Baseball.
While batting average only looks at the number of hits a player gets, OPS rewards home runs more than singles and also recognizes walks.
For example, Gophers centerfielder Matt Nohelty’s .397 batting average led the team by a wide margin, but he is fourth on the team in OPS because 82 of his 94 hits were singles.
It goes to reason, according to sabermetric proponents, that players who hit doubles, triples and home runs are more valuable than players who hit singles, and that players who walk more should also be recognized.
“Personally, I think OPS is hands down the best value,” Foley said. “We’re finding that things like ‘average’ just isn’t a good indicator of a player’s production.”
But not all sabermetrics are as easy to calculate.
Runs created, also developed by James, uses a more complex formula to determine how many runs a team would score if the entire lineup was made up of a single hitter. For example, the stat predicts that if the Gophers had nine DeSmidts in their lineup, they would average more than 11 runs per game. With nine John Hummel’s, they would average 2.5.
Even more complex is one of the most common sabermetrics for pitching – Fielding Independent Pitching, or FIP. The idea behind FIP is that a pitcher can only truly control three things: homeruns, strikeouts and outs. All other balls in play rely on the defense to get an out.
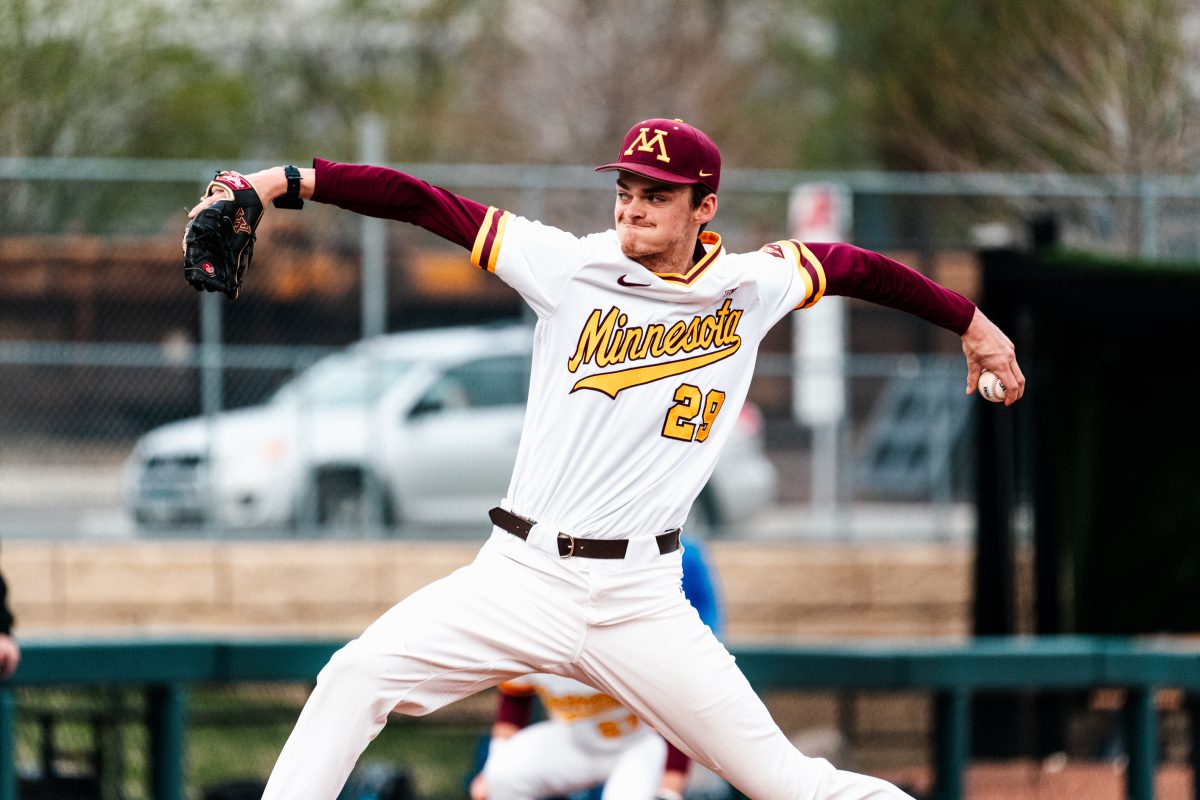
FIP numbers are adjusted to be in line with the commonly used Earned Run Average, or how many earned runs a pitcher gives up per nine innings, so that a pitcher whose FIP was dramatically lower than his ERA was, in theory, hurt by his team’s defense. Gophers reliever Scott Matyas had a 4.45 ERA this season, but a FIP of just 2.64.
“We keep doing more and more with it, and it’s becoming a big part of our program,” Anderson said. “I can remember doing it with a paper and pencil and calculator. It’s just unbelievable the stuff you can do today with technology.
“And it’s like we always say, the numbers don’t lie.”