
University of Minnesota researchers contributed to a new interactive map of the world showing the relationship between nature’s contributions to people and how people could be impacted by environmental change.
Researchers from the University of Minnesota contributed to a new interactive map of the world showing the relationship between nature’s contributions to people and how environmental change can impact them.
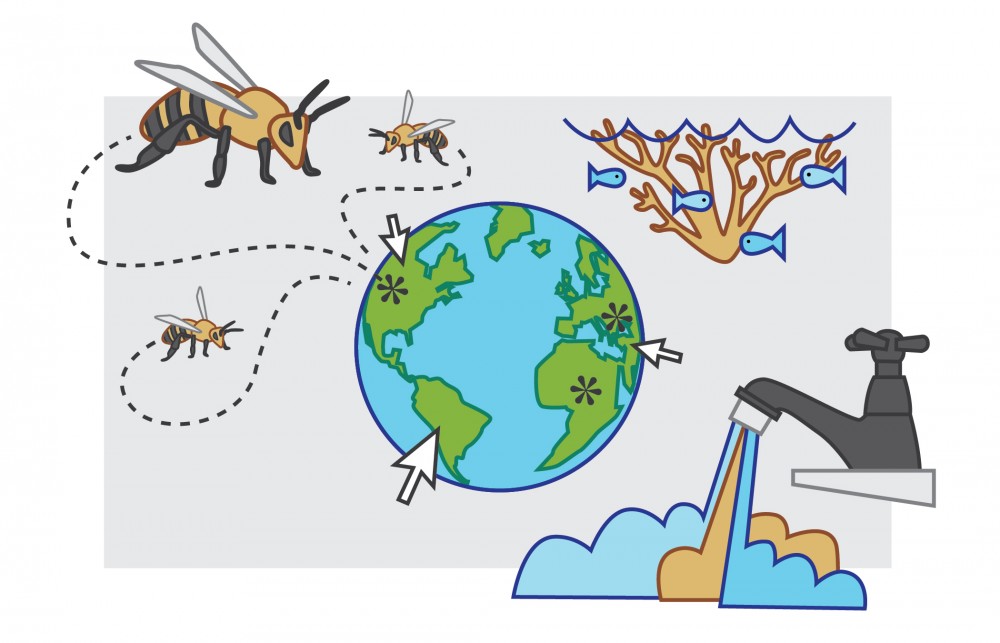
The map includes data for the present and projected risks for three main categories: water quality, coastal risks and crop pollination. Using this tool, policymakers can make more informed decisions about environmental legislation, researchers say.

“Decision-makers need to understand what the consequences of action (or inaction) on climate change, biodiversity loss, and ecosystem degradation are, and they need to know [them] at fine scales, for the whole world,” said Maike Hamann in an email to the Minnesota Daily, who became a part of this project when she began her postdoctorate at the University in 2017.
One of the reasons the study began was the need for better data on the importance of nature for policymakers, she said in the email.
Anyone who accesses the map can view nature’s contribution to people from almost anywhere in the world, Hamann said in the email.
This map is part of the Natural Capital Project, a 10-year collaborative partnership involving researchers from the University of Minnesota and Stanford University, as well as other organizations from around the world.
“At NatCap, we’re all about open data and the sharing of ideas and tools,” she said in the email. “That’s how science progresses, and it’s how the scientific community builds and maintains the public’s trust.”
According to Hamann, important findings in the project include the negative impacts of environmental destruction and how they are inequitably distributed across the world. Developing countries in Africa and South Asia were more disadvantaged by diminishing contributions from nature.
“This means that environmental protection is not just about ensuring our well-being and quality of life, it’s also a moral imperative and call for justice,” she said in the email.
Completing both the study and the interactive map took more than two years.
“The version [of the map] that’s up now is a very simplified and narrowed down version of a lot of different iterations,” said Charlotte Weil, a data scientist at Stanford for the project.
Researchers were on the frontlines to deliver to policymakers a map of this scale that had never been done before, she said.
“Where are the key areas and where are people most at risk in the future?” Weil said.
The novelty of the map, Weil said, is how local the data is and how that can inform policymakers in the future.
“I think it was academia at its most beautiful,” said Becky Chaplin-Kramer, lead author on the study and lead scientist for the Natural Capital Project at both the University of Minnesota and Stanford. “Imagine big rooms full of white boards and people arguing in scintillating ways.”
The project was a blank slate to show how meaningful this information can be to people and policymakers, and to articulate where the world’s concerns should be, she said.
“There’s a misconception that science is just about getting answers and it’s just about finding the truth,” Chaplin-Kramer said. “A lot of it is how do we interpret what the data is really telling us.”
Nobody has done a global assessment model specifically for ecosystems like this map, Chaplin-Kramer said.
The project, Intergovernmental Science-Policy Platform on Biodiversity and Ecosystem Services, was a part of what made them go global with this map, said Justin Johnson, a researcher and co-leader of the project at the University, in an email to the Minnesota Daily.
One of their colleagues at IPBES challenged them to create a global map, he said in the email.
“At first we thought this was not possible, but the idea stuck, and many thousands of person-hours later we succeeded,” Johnson said in the email.
Using this model now, they can make further progress in looking at nature’s contributions from different perspectives, and have advanced their research since its completion, Chaplin-Kramer said.
“The point is, data isn’t going to be a barrier anymore,” she said. “It’s up to us to make sense of it.”