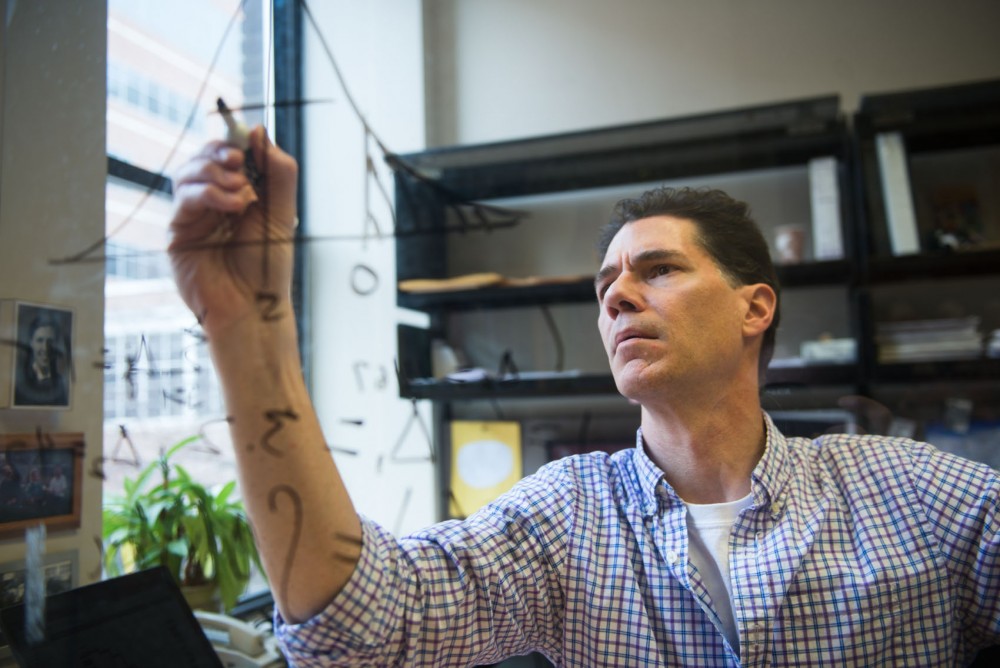
Brad Carlin was puzzled when other people devised better brackets than his own in his NCAA March Madness pool for the Division I men’s basketball tournament.
As a biostatistics professor, he couldn’t let that keep happening. So, he brought the mathematics of the tournament to his research.
“I was losing to guys that didn’t know what the hell they were doing,” Carlin said. “Guys that were picking their brackets based on the color of the shorts or something like that.”
Carlin, who’s now head of the University of Minnesota’s Biostatistics department, created an algorithm to enhance his chances of winning his March Madness pool.
The results were beneficial for Carlin — to a point.
“I was in a pool when I came in first three out of five years,” he said, “and then they invited me not to participate in that pool anymore.”
Sports became the driving force that interested Carlin in statistics.
The Chicago native kept statistics on the Cubs as a hobby growing up, which was difficult because “they’re usually bad,” he said.
Still, Carlin looked for more out of the data than just batting averages, slugging percentages and so on.
“It’s not enough to summarize the data, you have to make inferences about it like, ‘What’s the probability that this [bracket] is going to win?’” he said.
Carlin’s appreciation for data combined with his love for math and probability theory resulted in his career path as a statistician. But his desire to have more success in his March Madness pool led him to delve further into it.
Carlin’s method pays particular attention to probability and the need to be different from the crowd.
Each game has an outcome shaped like a bell curve, with the middle of the curve representing the game’s point spread.
The width of the bell, on average, amounts to 11 or 12 points standard deviation in college basketball, Carlin said.
“If you and I agree to play the spread, you’ll win half the time and I’ll win half the time,” he said.
In the first round, Carlin pays particular attention to the point spread placed on games from Las Vegas bettors.
“The guys that bet on basketball are the gold standard,” he said. “When the spread is in single digits, you can really go either way. There’s always a few upsets.”
With that method, though, people tend to over-bet the favorites.
So, to distinguish his bracket from others, Carlin said he tries to pick differently toward the final rounds.
“Think a little bit contrarian, and don’t follow the crowd. You certainly want your one seeds to get into the Sweet 16 and maybe further, but don’t feel you have to pick all ones in the Final Four,” he said. “That would make your sheet too similar to everyone else, and you’ll have to be perfect in the other areas to win.”
Carlin is one of a handful of academics that have written papers on this strategy of filling out the bracket.
He joined his then-master’s student Jarad Niemi, now an assistant professor in Iowa State’s statistics department, for Niemi’s thesis on the contrarian strategy.
“We had three years of actual bracket sheets … and asked ourselves ‘What kind of bracket should we have that would beat all the others?’” Niemi said.
The method Carlin and Niemi worked on is now available online, thus eliminating the edge they once had in pools.
Edward Kaplan, an operations research professor at Yale University, also authored a paper on a similar method.
Using his method, Kaplan said one of his former brackets finished about 30th out of 100,000 in a CBS Sports pool.
Filling out a perfect bracket isn’t attainable statistically, with nine quintillion different possibilities.
“That’s a nine with 18 zeros after it,” Kaplan said. “So yeah, a perfect bracket will never happen.”
And while fans become enamored with the Cinderella teams and crazy comebacks, Kaplan said sports present an optimal environment for learning math.
“Sports turned out to be a terrific way to get other people interested in probability and statistical bundling,” he said. “Not everybody is interested in those applications like that with public health or politics.”
Many organizations, like data-driven news outlet FiveThirtyEight, published their own probability statistics for those interested in filling out their bracket with the numbers.
The contrarian method “was perfect for this year,” Niemi said, because of the nation’s confidence in undefeated Kentucky.
“Say you pick a team other than Kentucky and your team wins,” Niemi said. “You’re basically sure to win because so many people will pick Kentucky.”
In his pool, Carlin had the luxury of filling out two brackets.
He picked Kentucky in one and Villanova — which already lost — in the other, with slight differences along the way in each bracket.
“I just couldn’t get away from them, though I’m normally a contrarian,” he said. “So, I put a few more upsets in my Kentucky sheet because I figured I needed to get an edge.”
On ESPN’s bracket challenge, nearly 50 percent of participants have Kentucky — the top overall seed — winning the tournament.
FiveThirtyEight set Kentucky’s probability of winning the tournament at 41 percent.
Carlin said the climate has changed for statisticians thanks to people like FiveThirtyEight founder Nate Silver.
“Now, Nate Silver’s made the world safe for nerds,” he said. “It’s cool to be nerdy again and into statistics.”


